Have you ever wondered how would the dry figures and dry statistics of your business be transformed into a captivating story, full of relevant information? Well, with Microsoft Power BI, this is possible! Stay with us to understand what this bi power is and how you can use it to your advantage.
If you have read articles on our blog, you may certainly notice that we like to associate technological tools with real life examples. Why? To better understand the concepts in the vast technological world. This is the reason why we invite you to associate Power Bi with a detective of your data. It collects information from various sources, whether we are talking about simple Excel files, complex databases or even cloud services such as Google Analytics and transforms them into a clear and easy to understand painting.
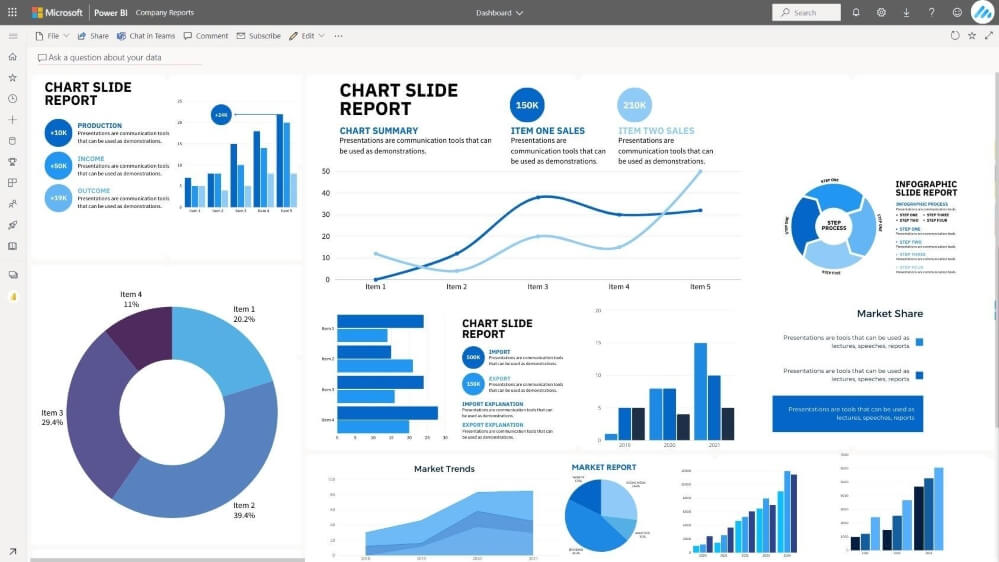
In particular, what is Power Bi doing?
- It connects.
- Transform.
- Model.
- View.
- Analyses.
- Share.
Why do you need this «data detective»?
Because, as in any investigation, gross data can be overwhelming and difficult to interpret. Power Bi helps you discover hidden clues in data and transform them into precious information, which can help you make better decisions and improve your company’s performance.
Articulos que te pueden interesar What is it from the GPT chat?
Example: imagine being the manager of an online store. Power BI can collect sales data, customers, marketing and campaigns products, analyze them and give you answers to questions such as:
- What are the most popular products?
- What customers of customers generate the highest income?
- What marketing campaigns have had the greatest impact?
- What are the long -term sales trends?
With this information at hand, it is possible to make informed strategic decisions, such as the regulation of stocks, the customization of offers or the optimization of marketing campaigns.
How does Power Bi work?
Power BI works as an integrated system with different components that work together to transform data into precious information:
- Data connection: Power BI can connect to a multitude of sources of data, from simple files, to complex databases such as SQL Server or Oracle and even cloud services such as Salesforce or Google Analytics. You can connect directly to your data or import them to Power BI.
- Transformation of data (Potenza Query): Once connected to the sources, Power BI allows you to turn and clean the data. It is possible to remove duplicates, complete the missing values, change the types of data, combine tables and more. This phase is essential to ensure that your data is prepared for analysis.
- Data modeling: After the data is clean, Power BI allows you to create a data model. It defines the relationships between different tables and columns, creating a coherent structure for further analyzes.
- View creation (Report and Dashboard): Now comes the fun part! Power Bi offers a wide range of views, such as graphics, diagrams, maps and tables, to present your data intuitive and attractively. You can create interactive reports, which allow you to explore the data in depth and personalized dashboard, which give you an overview of the most important aspects of your business.
- Sharing and collaboration: Power BI allows you to easily share reports and dashboard with your colleagues or customers. You can publish reports in the cloud, incorporate them into applications or websites or send them by e-mail. Power Bi also facilitates collaboration, allowing you to work with your team in the same relationships and dashboard.
- Data update: To make sure that reports are always increasing, in power, Power BI allows you to configure automatic data updates. Therefore, you don’t have to worry about making decisions based on obsolete information.
In short, Power Bi takes your raw data, transforms them into an easy -to -understand format and gives you the necessary tools to analyze them and obtain valuable information.
Articulos que te pueden interesar Advantages of learning based on the project in it
What can you do with Microsoft Power BI?
Through a variety of applications, Power Bi offers solutions adapted to the specific needs of each sector. Below I prepared some examples to understand what you can do with Power BI:
See retail:
- Granular analysis of sales and performance of the products: Power BI allows detailed sales analysis on various sizes (products, categories, locations, periods), facilitating the identification of trends, high performance products and growth opportunities.
- Optimization of the supply chain: By integrating with equity management systems, Power Bi offers real -time visibility on escort levels, allowing retailers to anticipate and prevent too stocal or lack of actions.
- Segmentation and customization of the customer’s experience: By aggregating the data from various sources (loyalty programs, chronology of acquisitions), Power BI facilitates the understanding of customer behavior, identifying segments of highly value customers and personalizing offers and communications.
Finance:
- Complex financial reporting and detailed analysis: Power BI allows the generation of complex financial reports, according to the specific standards of the sector, and offers advanced analysis tools for investment performance, risk monitoring and identification of growth opportunities.
- Modeling and financial forecasts: Through the functions of modeling and predictive analysis, Power BI allows the creation of scenarios and financial forecasts, facilitating long -term strategic decisions.
- Detection of anomalies and fraud: By analyzing great volumes of transactional data, Power BI can identify unusual models and report the potential fraud, contributing to the protection of the financial activities of organizations.
Health:
- Analysis of medical data and patient chronology: Power BI allows the integration and analysis of medical data from various sources (electronic health files, laboratory results, medical images), facilitating the customization of the treatment plans and the improvement of the quality of the care.
- Monitoring of medical performance indicators: Power BI can be used to trace and evaluate key performances in the field of health (infections no -), waiting times, patient satisfaction), contributing to the optimization of processes and to increase operational efficiency.
- Medical research and clinical studies: By aggregating and analyzing the data from clinical studies, Power BI can accelerate the medical research process and can contribute to the identification of new treatments and therapies.
Education:
- Evaluation of the performance of students and the personalization of learning: Power BI allows the analysis of the academic performance of the students, identifying individual needs and adapting the teaching methods to maximize the results.
- Monitoring of the educational progress and the effectiveness of the programs: By aggregating the data in class, school or district, Power BI can evaluate the effectiveness of educational programs and identify the opportunities for improvement.
- Planning of strategic resources: Power Bi facilitates the optimization of the allocation of educational resources (teaching staff, didactic materials) according to the specific needs of the students and the objectives of the institution.
If the applicability of Power Bi has attracted your attention and want to deepen your knowledge in the field of data analysis, we recommend that you explore the Newtech Academy courses. Here you can learn directly from the best mentors how to become a date of successful analyst, applying the best practices and techniques in the analysis of the data.

Microsoft Power Bi limitations
Although Microsoft Power Bi is a powerful and versatile tool, there are some limitations and aspects that cannot achieve optimally:
1. Unable to perform predictive analyzes and automatic learning on an advanced level
Although Power Bi offers some predictive analysis and automatic learning functions, they are relatively limited to the tools specialized in this field. For complex models and advanced analyzes, it may be necessary to integrate with other specialized platforms.
2. Unable to analyze unstructured data
Power BI is optimized to work with structured data, such as database or Excel files. The analysis of unstructured data, such as the text in E -mail or documents, requires specialized tools and techniques, which are not available in a native way in Power BI.
3. It cannot completely automate business processes
Power BI can be used to monitor and analyze business processes, but cannot completely automate these processes. For automation, it is necessary to integrate with other specialized tools and platforms.
4. It cannot generate complex narrative content
Power BI is excellent for the creation of visual reports, but it is not designed to generate complex narrative content, such as detailed reports or executive summaries. For this type of content, it is possible to need human intervention or the use of specialized text generation tools.
5. Impossible to manage extremely large data volumes
Although Power Bi can manage large volumes of data, there are limitations in terms of performance and scalability when working with extremely high data sets (Petabyte or Exabyte). In such cases, the use of specialized Big Data solutions may be necessary.
6. It does not completely replace human competence
Power Bi is a powerful tool, but cannot completely replace human skills in the interpretation of data and in the decision -making process. It is important to use Power BI as a tool to support decisions, not as a substitute for critical thinking and professional experience.
Our conclusion?
Microsoft Power Bi is certainly a powerful tool, but it is important to understand both its strengths and its limits. By combining Power BI with other specialized tools and technologies, it is possible to obtain a complete and efficient solution for the management and capitalization of data.
latest posts published

Personal Branding or cult of personality?

6 Key SEO Steps Before Launching a New Website

Communicating during the financial crisis

11 good resolutions to give a boost to your 2019

It all starts with an idea

6 marketing and creativity books to read this year!

Content Marketing: Do You Really Have to Offer All Your Content?

Entrepreneurs and content marketing: 16 quotes to encourage you

9 tips to increase your blog audience!